Reports
Cockpit’s Reports give you aggregated views over historic execution data, complementing the per-instance and per-definition views elsewhere in Cockpit.
Enterprise Feature
Reports are available only in the Enterprise Edition.
Process Instance Duration Report
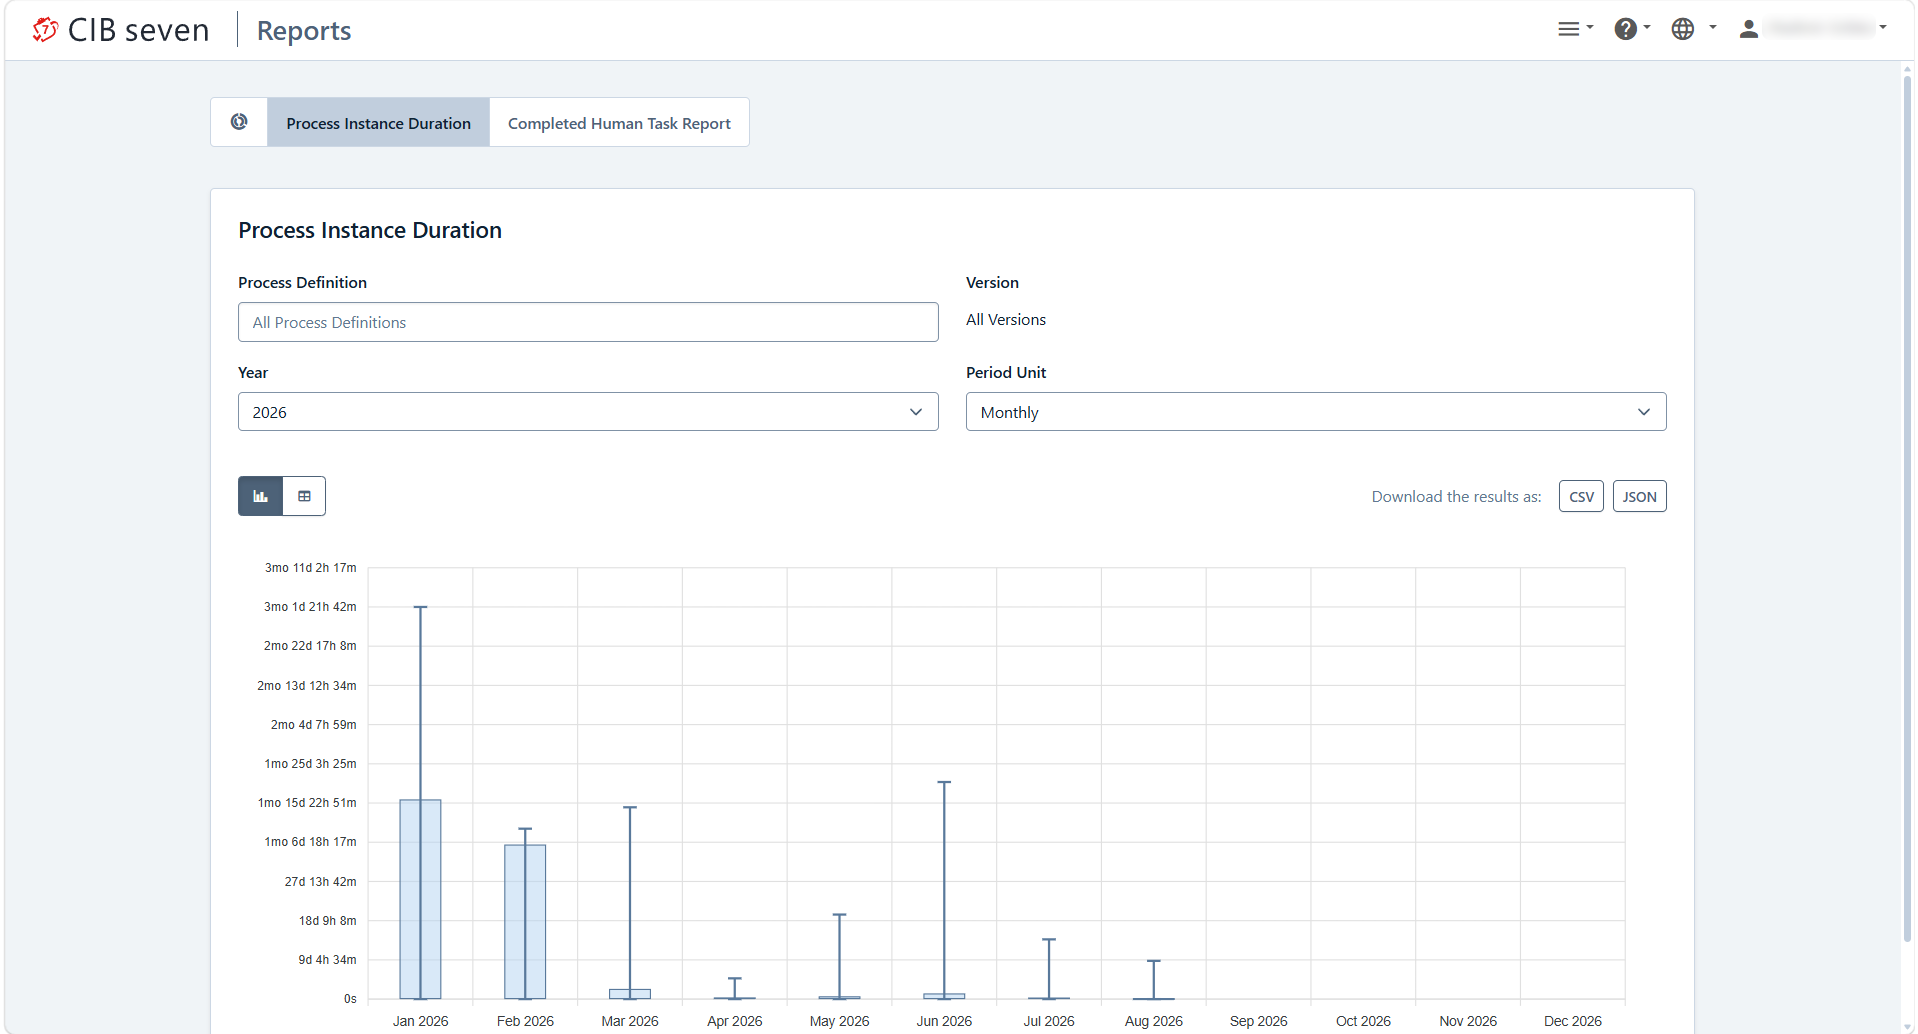
The Process Instance Duration Report shows how long process instances of a given process definition and version take to complete, grouped per year and period unit (for example monthly). Each period is plotted as a range from minimum to maximum duration with the average highlighted, so you can spot processes that are trending slower over time. Switch between the chart and a table view, and download the underlying data as CSV or JSON.
Completed Task Instance Report
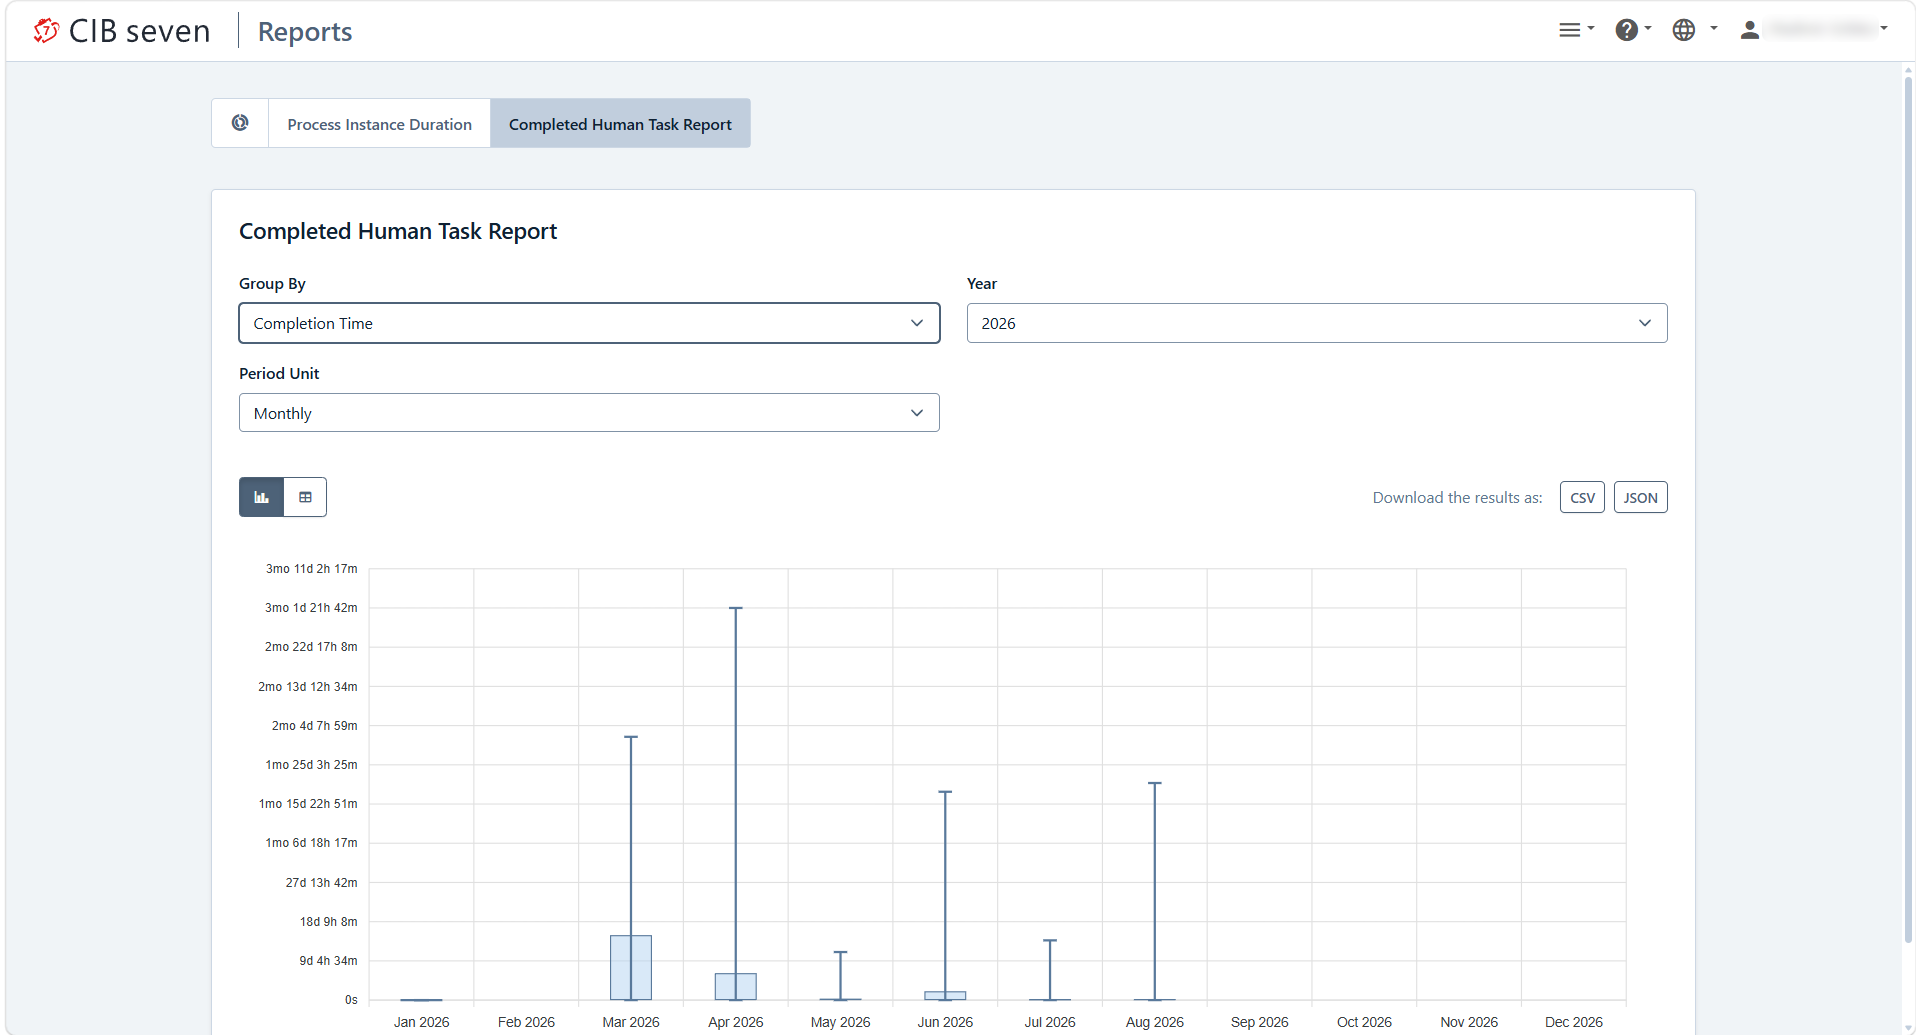
The Completed Task Instance Report shows completion time for finished human tasks, grouped by completion time over a selectable year and period unit. As with the duration report, each period shows average, minimum and maximum, with a chart and table view and CSV/JSON download, so you can analyze task throughput across a process, an assignee, or a time range.