Process Definition View
Community Features
The process definition view provides you with information about the definition and the status of a process.
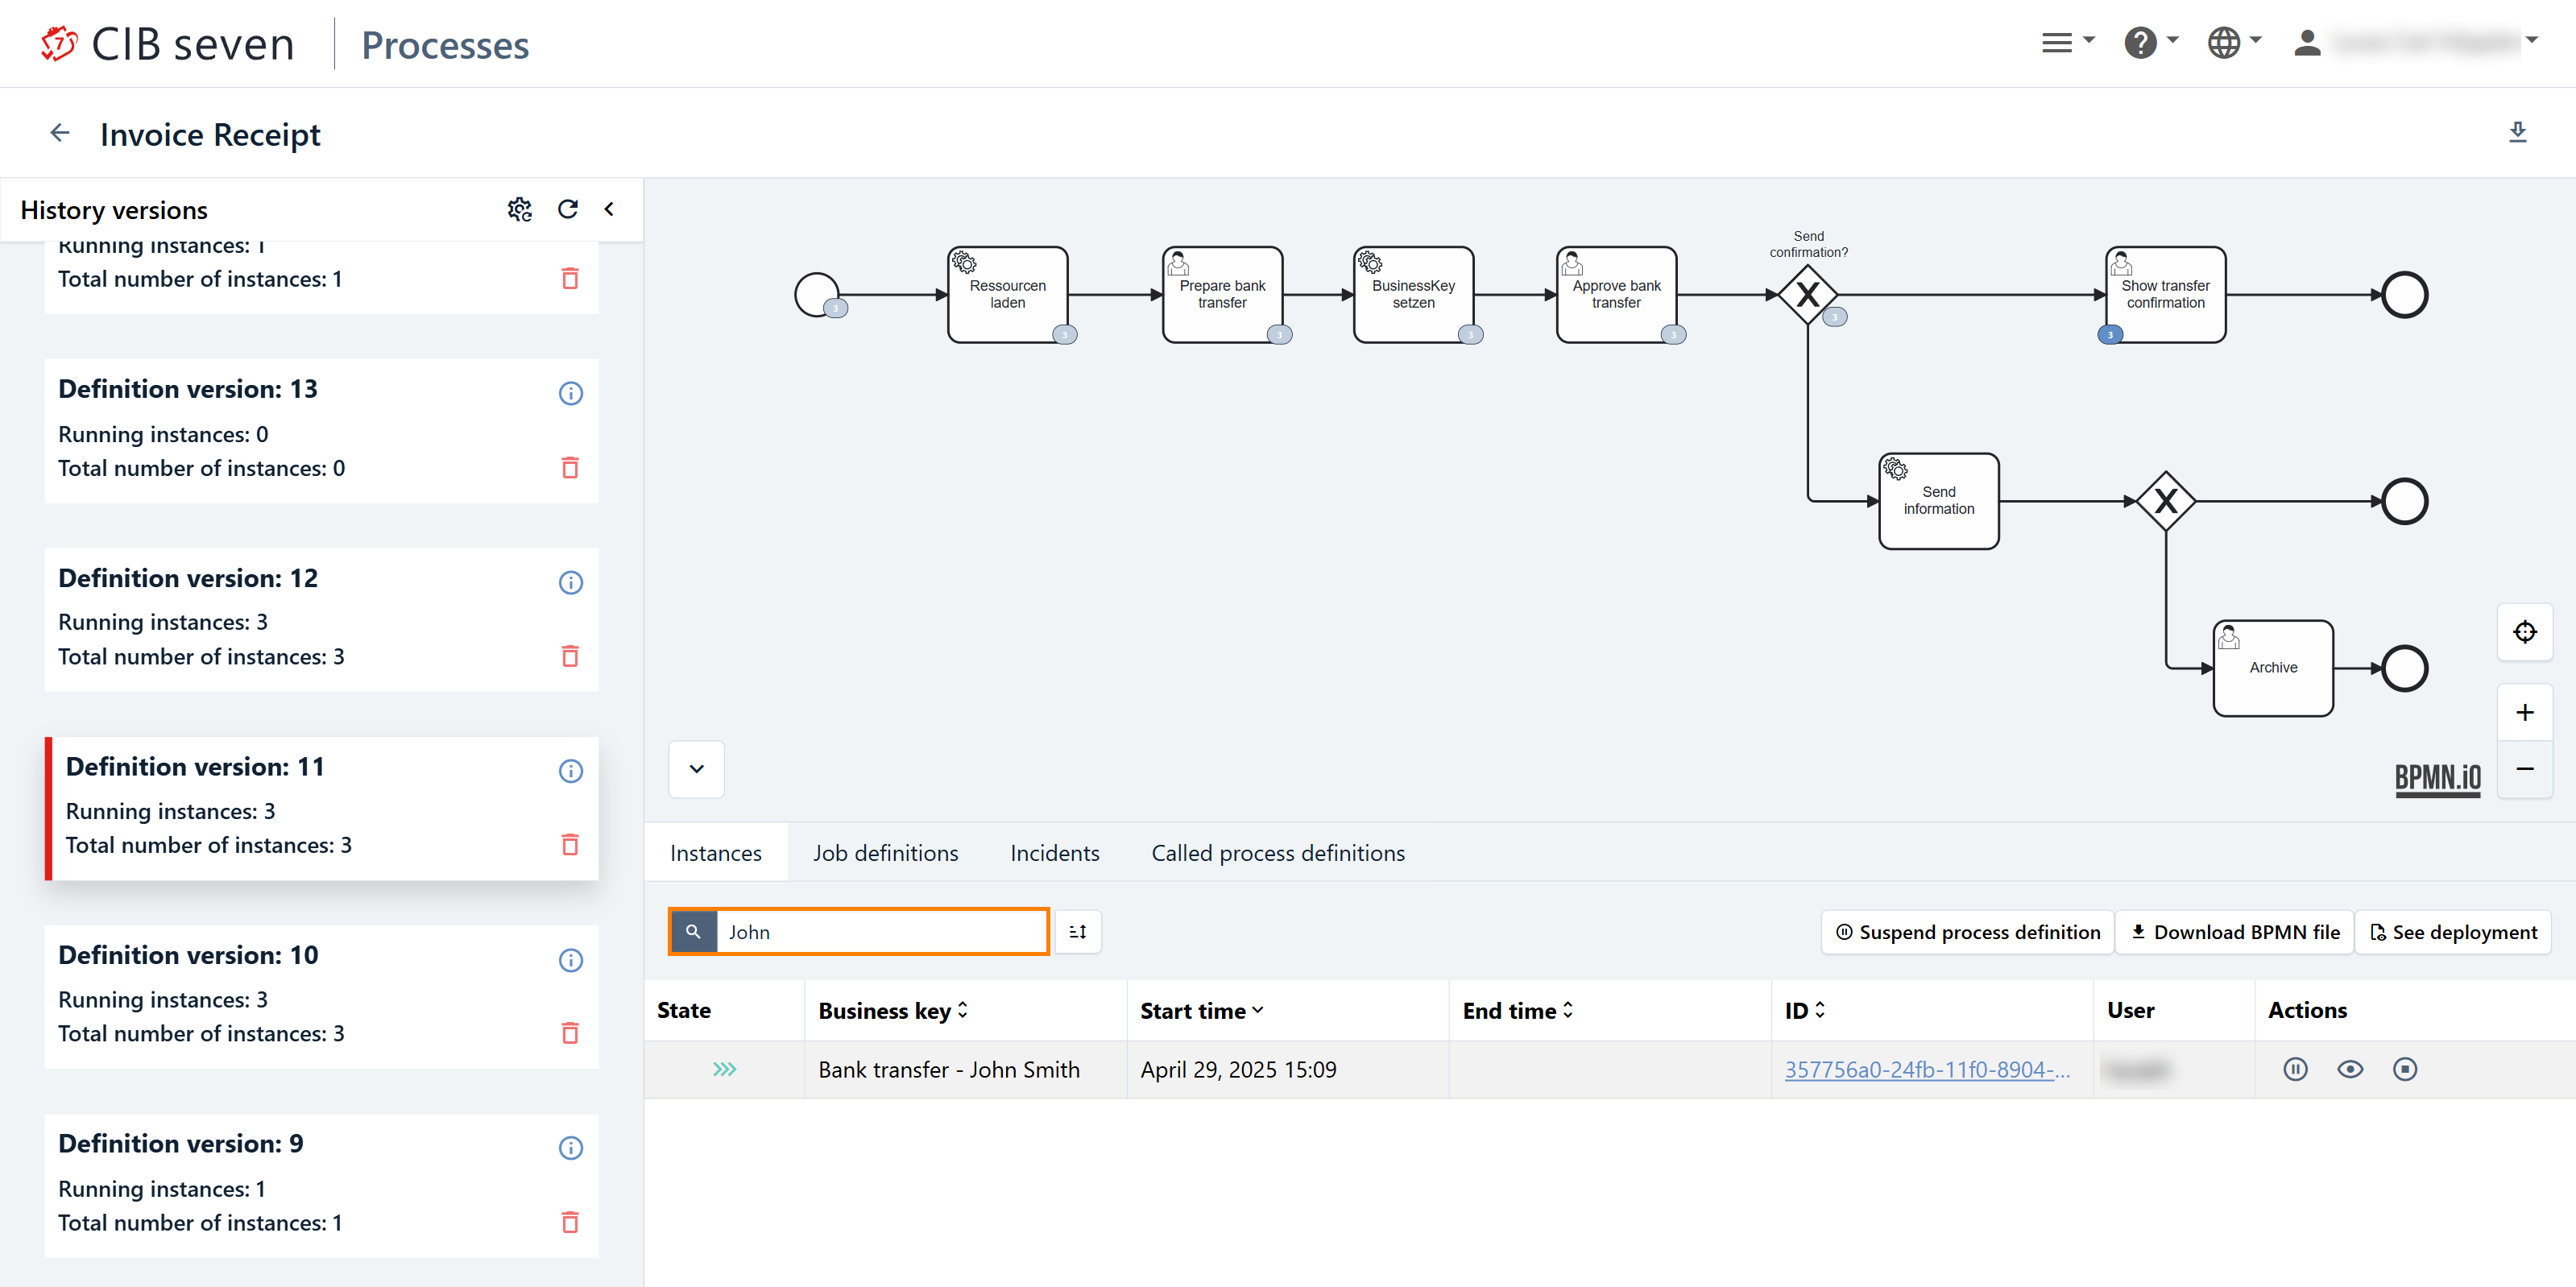
On the left side, you can easily view the versions of the process along with the number of instances currently running for each version. There, you will also find an information icon that you can hover over to display additional details about the specific deployment. Additionally, a trash icon is available, which allows you to delete a deployment. Please note: If you delete a deployment, all running instances associated with it will also be removed.
On the right side, the process model is displayed. As soon as a process instance is running, blue-filled circles appear, indicating the number of currently active activities. If incidents occur, red-filled circles show the number of incidents. Grey circles mark activities that have already been completed. This makes it easy to locate failed activities within the process.
In the lower part of the view, you will find a search bar that allows you to search for a business key. Refer to the next screenshot, where the options mentioned above are highlighted with orange frames. Take a moment to familiarize yourself with this view first.

Use the mouse to navigate through the diagram. Hold the left mouse button to pan the diagram in the desired direction. By holding the CTRL key while scrolling the mouse wheel, you can zoom in and out. Alternatively, you can use the plus and minus icons on the right side. There is also an option to reset the zoom in that area.
In the Instanced tab, all running instances are displayed in a table format. In addition to details such as the start and end time, business key, process ID, and user, you can perform various actions. The pause icon allows you to suspend or activate the process instance, the eye icon lets you open the Process Instance View, and the stop icon enables you to delete the process instance.
The Job Definitions tab displays the job definitions that are linked to this process definition. You can observe the name of the activity, the type of job, the configuration, and the state of each job. You can also suspend and re-activate the job definition (see Suspension for more information).
The Incidents tab displays details about incidents, including the error message, timestamp, current activity, and the failed activity. It also allows you to add notes or increase the number of retries. For more information, see the section Failed Jobs.
The Called Process Definitions tab displays details about called processes, such as call activities and Failed Jobs.
CSV Export for Process Instances
Sometimes, incidents may require the Operations Engineer to intervene manually. However, these incidents might not always be solvable from the Cockpit if other services or systems are involved. In such cases, we have a feature to export the affected process instances and their process variable values as CSV spreadsheets. This export feature helps facilitate efficient communication with other system owners. In the process instance view, you’ll find a download icon in the upper-right corner. The icon is highlighted with an orange frame in the following screenshot.

When you click the button, the download of the CSV file will start, and soon you should see your CSV export in your browser. The format of the export result is a file of Comma-separated values (CSV) (opens an external link to Wikipedia). The structure of the CSV is shown in the next screenshot, where you will find an example of the CSV file opened in MS Excel. The columns include 'state', 'business key', 'start time', 'end time', 'ID', 'user', 'definition name', and 'definition version'.

Each row in the spreadsheet represents a process instance, while each property has its dedicated column. The spreadsheet has a separate column for each variable property and displays its value in the respective row that matches the process instance.
Instances Tab
Search process instance
The case-sensitive search bar allows you to search for a specific process instance using the business key. Additionally, you can define a sorting criteria. In the following screenshot, we search for the process instance with a business key containing John. The search area is marked with an orange frame.
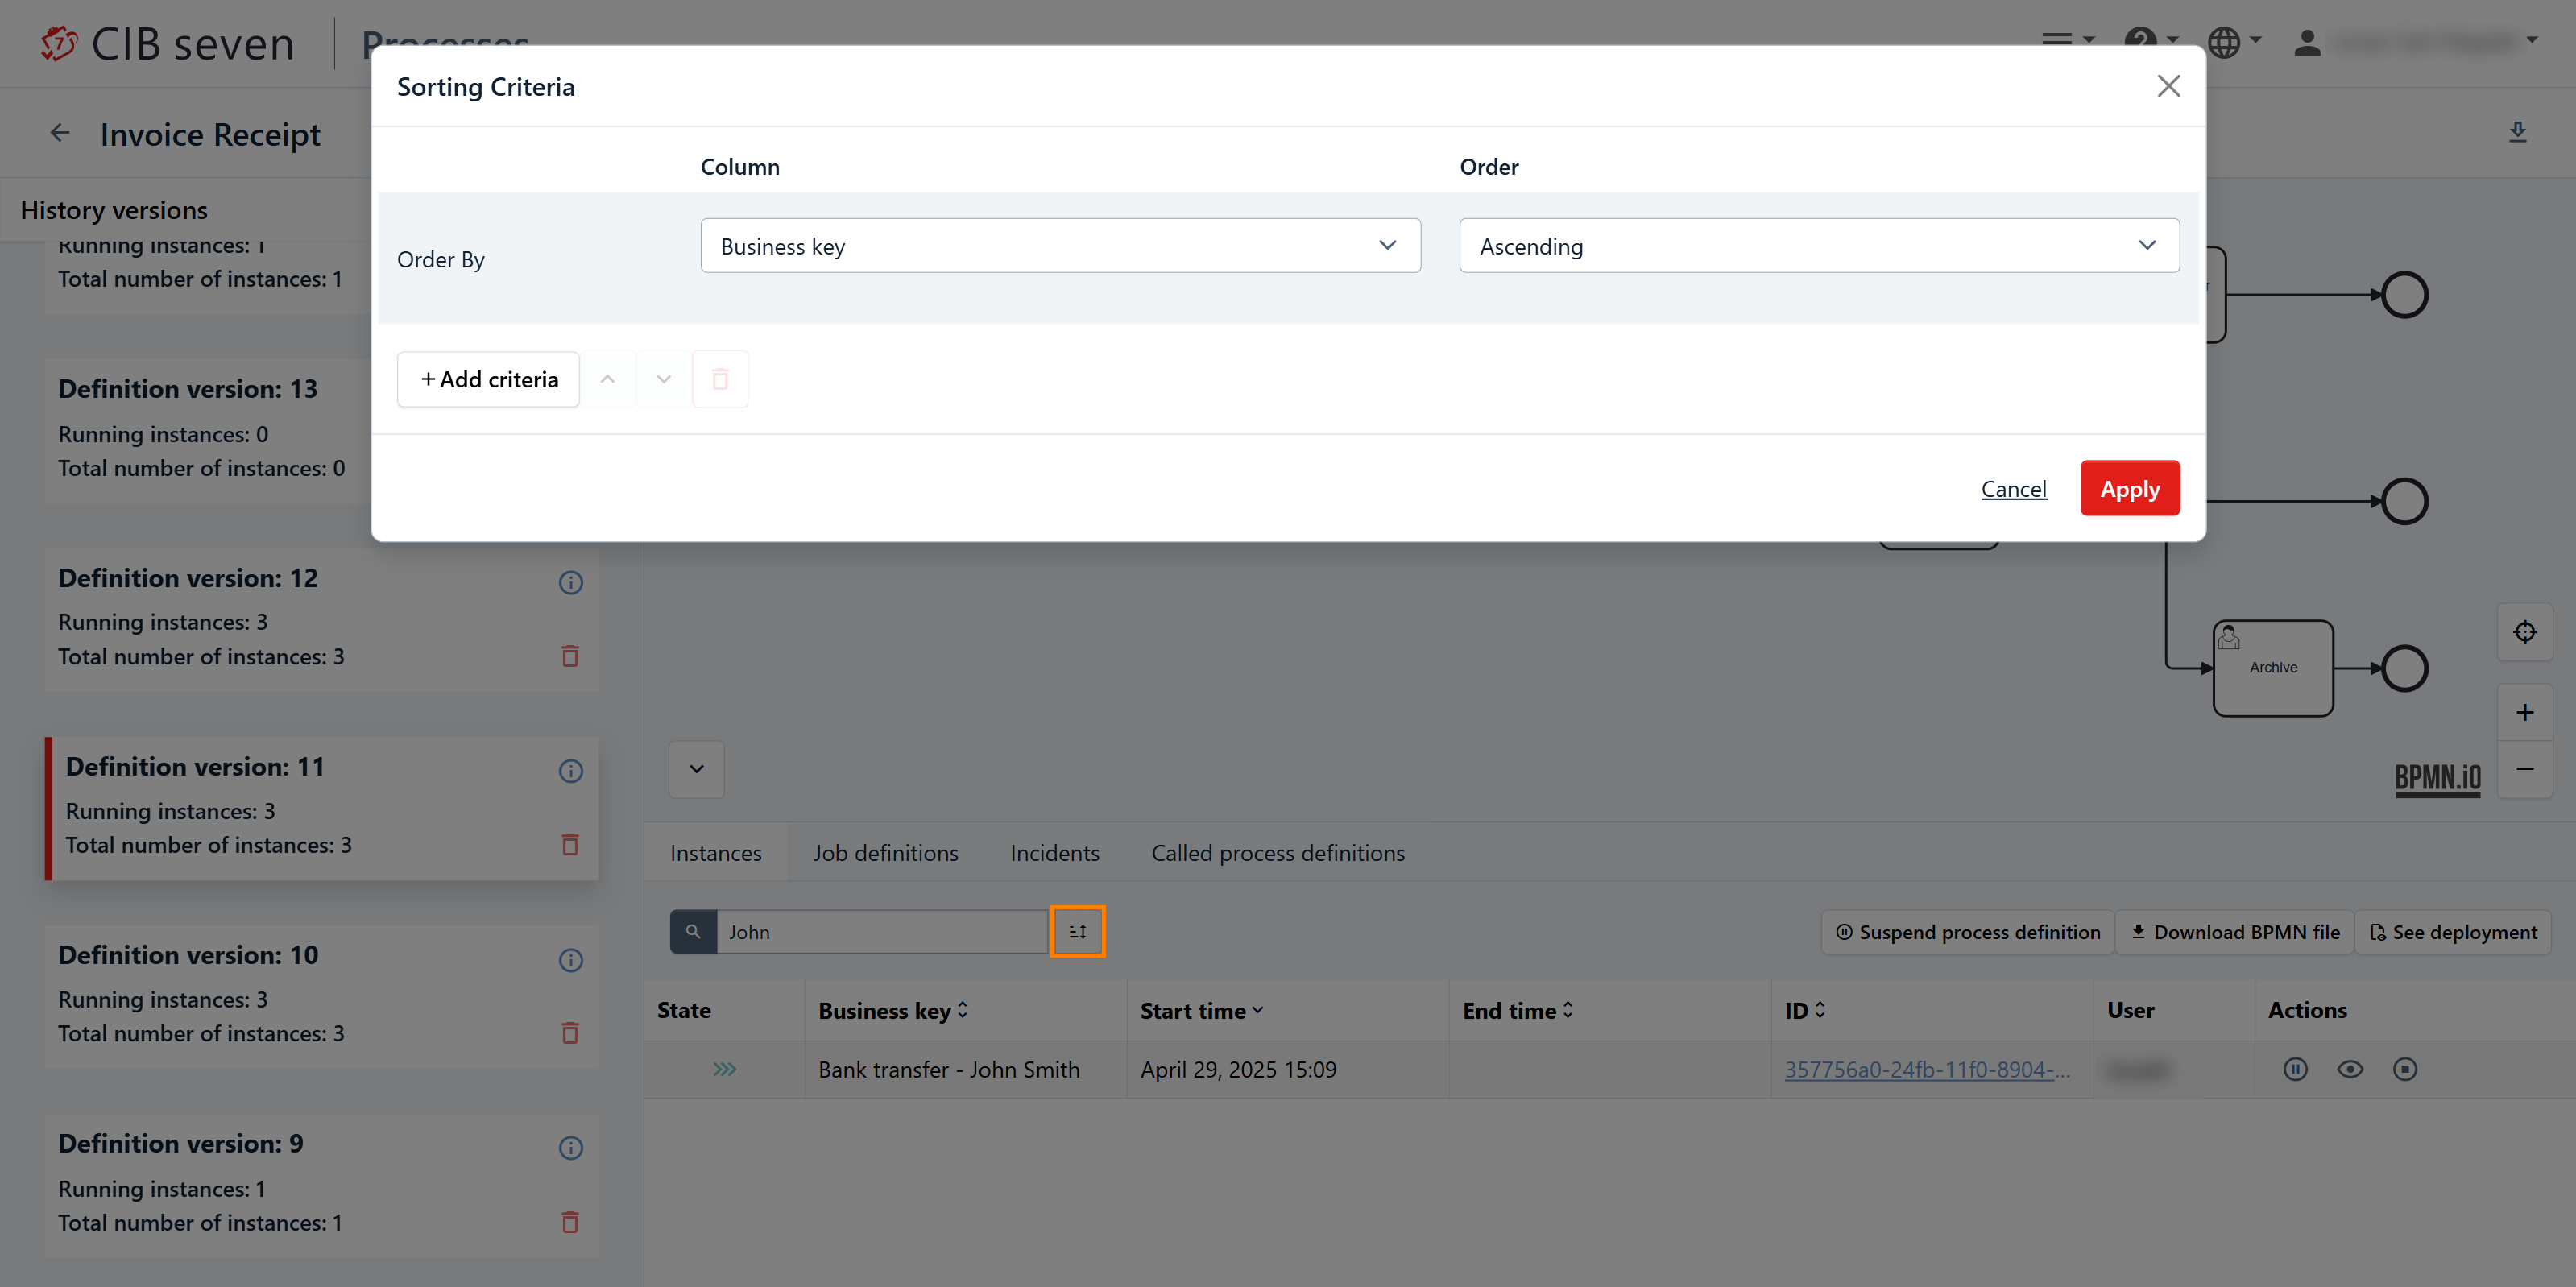
When you click the icon next to the right of the search bar, a modal dialog opens. Here, you can apply one or more sorting criteria. Choose from values such as state, business key, start time, end time, ID, user, and incidents, and specify whether the order should be ascending or descending. To add more criteria, click the 'Add Criteria' button. You can rearrange the criteria using the small arrow icons to move them up or down, and remove them by clicking the trash icon.
Cancel a Process Instance
In the process instance view, you can cancel a single process instance by clicking the trash icon on the right. A confirmation dialog will appear, and the runtime data of the canceled instance will be deleted when you click the 'Delete' button.

Job Definitions Tab
In the Job Definitions tab, you can see the currently called activities. From left to right, the table includes the following columns: 'state', 'activity', 'type', 'configuration', 'overriding job priority', and 'actions'.

In the Actions column, you can change the job priority by overriding the priority specified in the BPMN 2.0 XML. To do so, click on the icon on the right. In the opened dialog, you can override the job priority. If an overridden priority is already set, you can clear it to revert to the priority specified in the BPMN. The pause icon allows you to suspend the process instance,
Incidents Tab
In case of an incident, the message will be displayed in the Incidents tab. Here, you can find key information about the incident, including the error message, the timestamp of when the error occurred, the activity in which the error happened, the name of the failed activity, and the incident type. This tab provides an overview of all the relevant details that can help troubleshoot the issue.
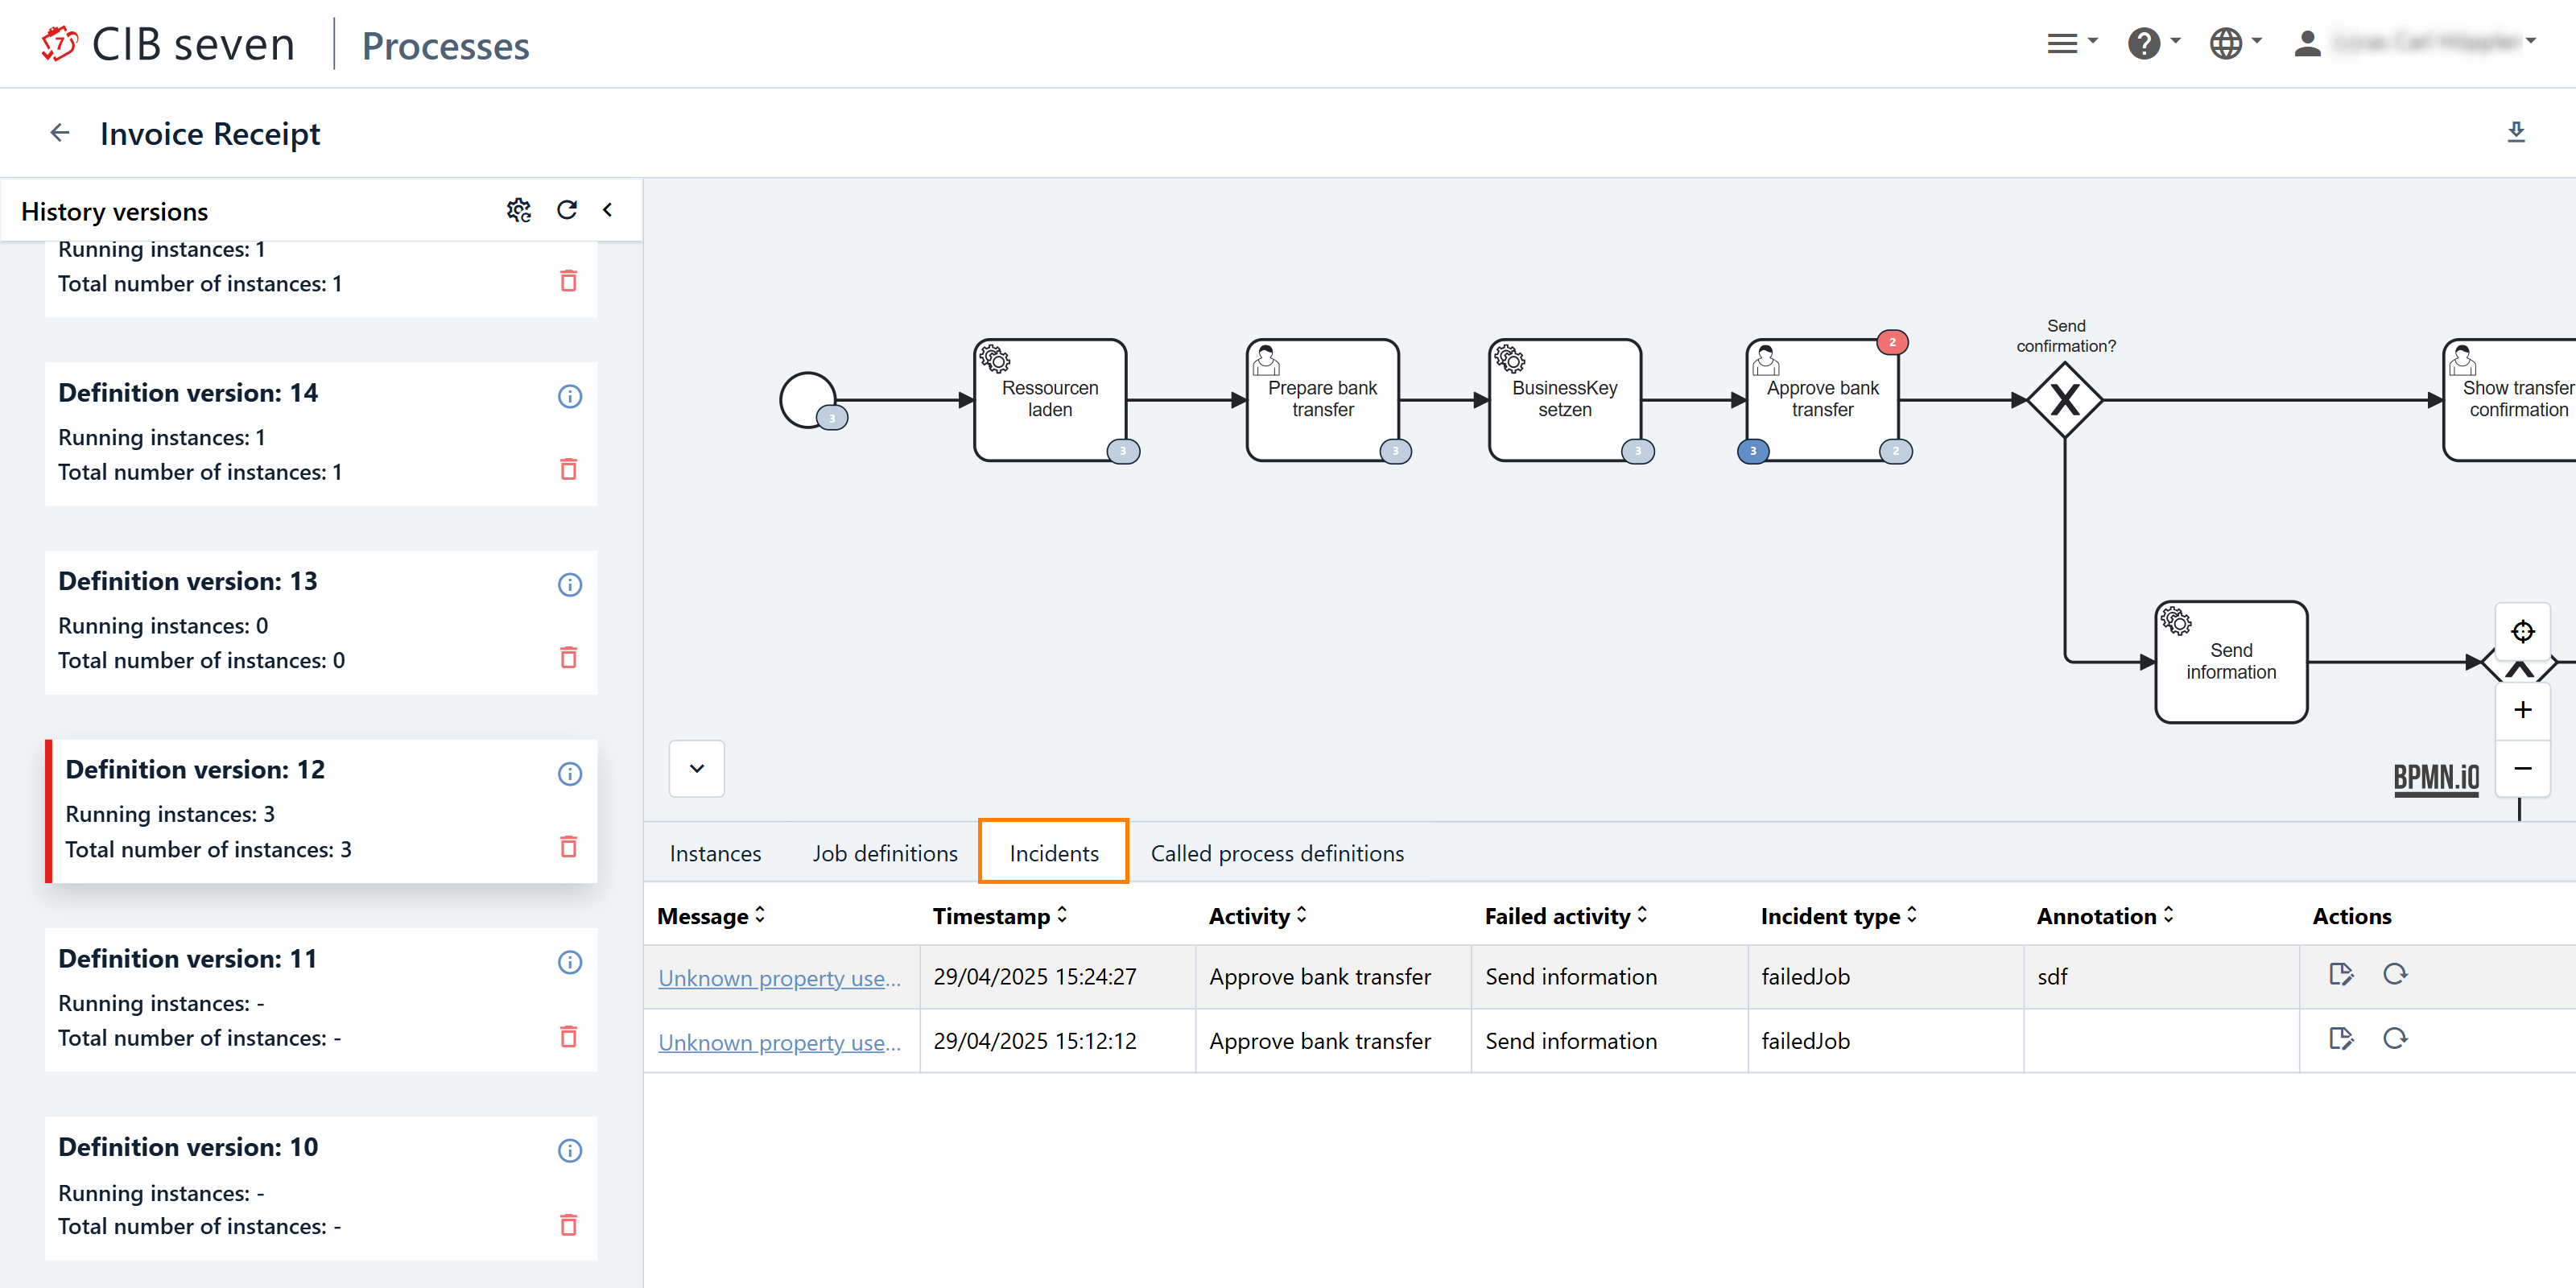
For more detailed information, you can click on the blue link of the error message. This will open a detailed view where you can examine the specifics of the incident. In this view, you also have the option to copy the full stack trace, which can be useful for debugging. You can then share the stack trace, for instance, with the process developer to help them understand and resolve the issue. This function is marked in orange in the next screenshot.
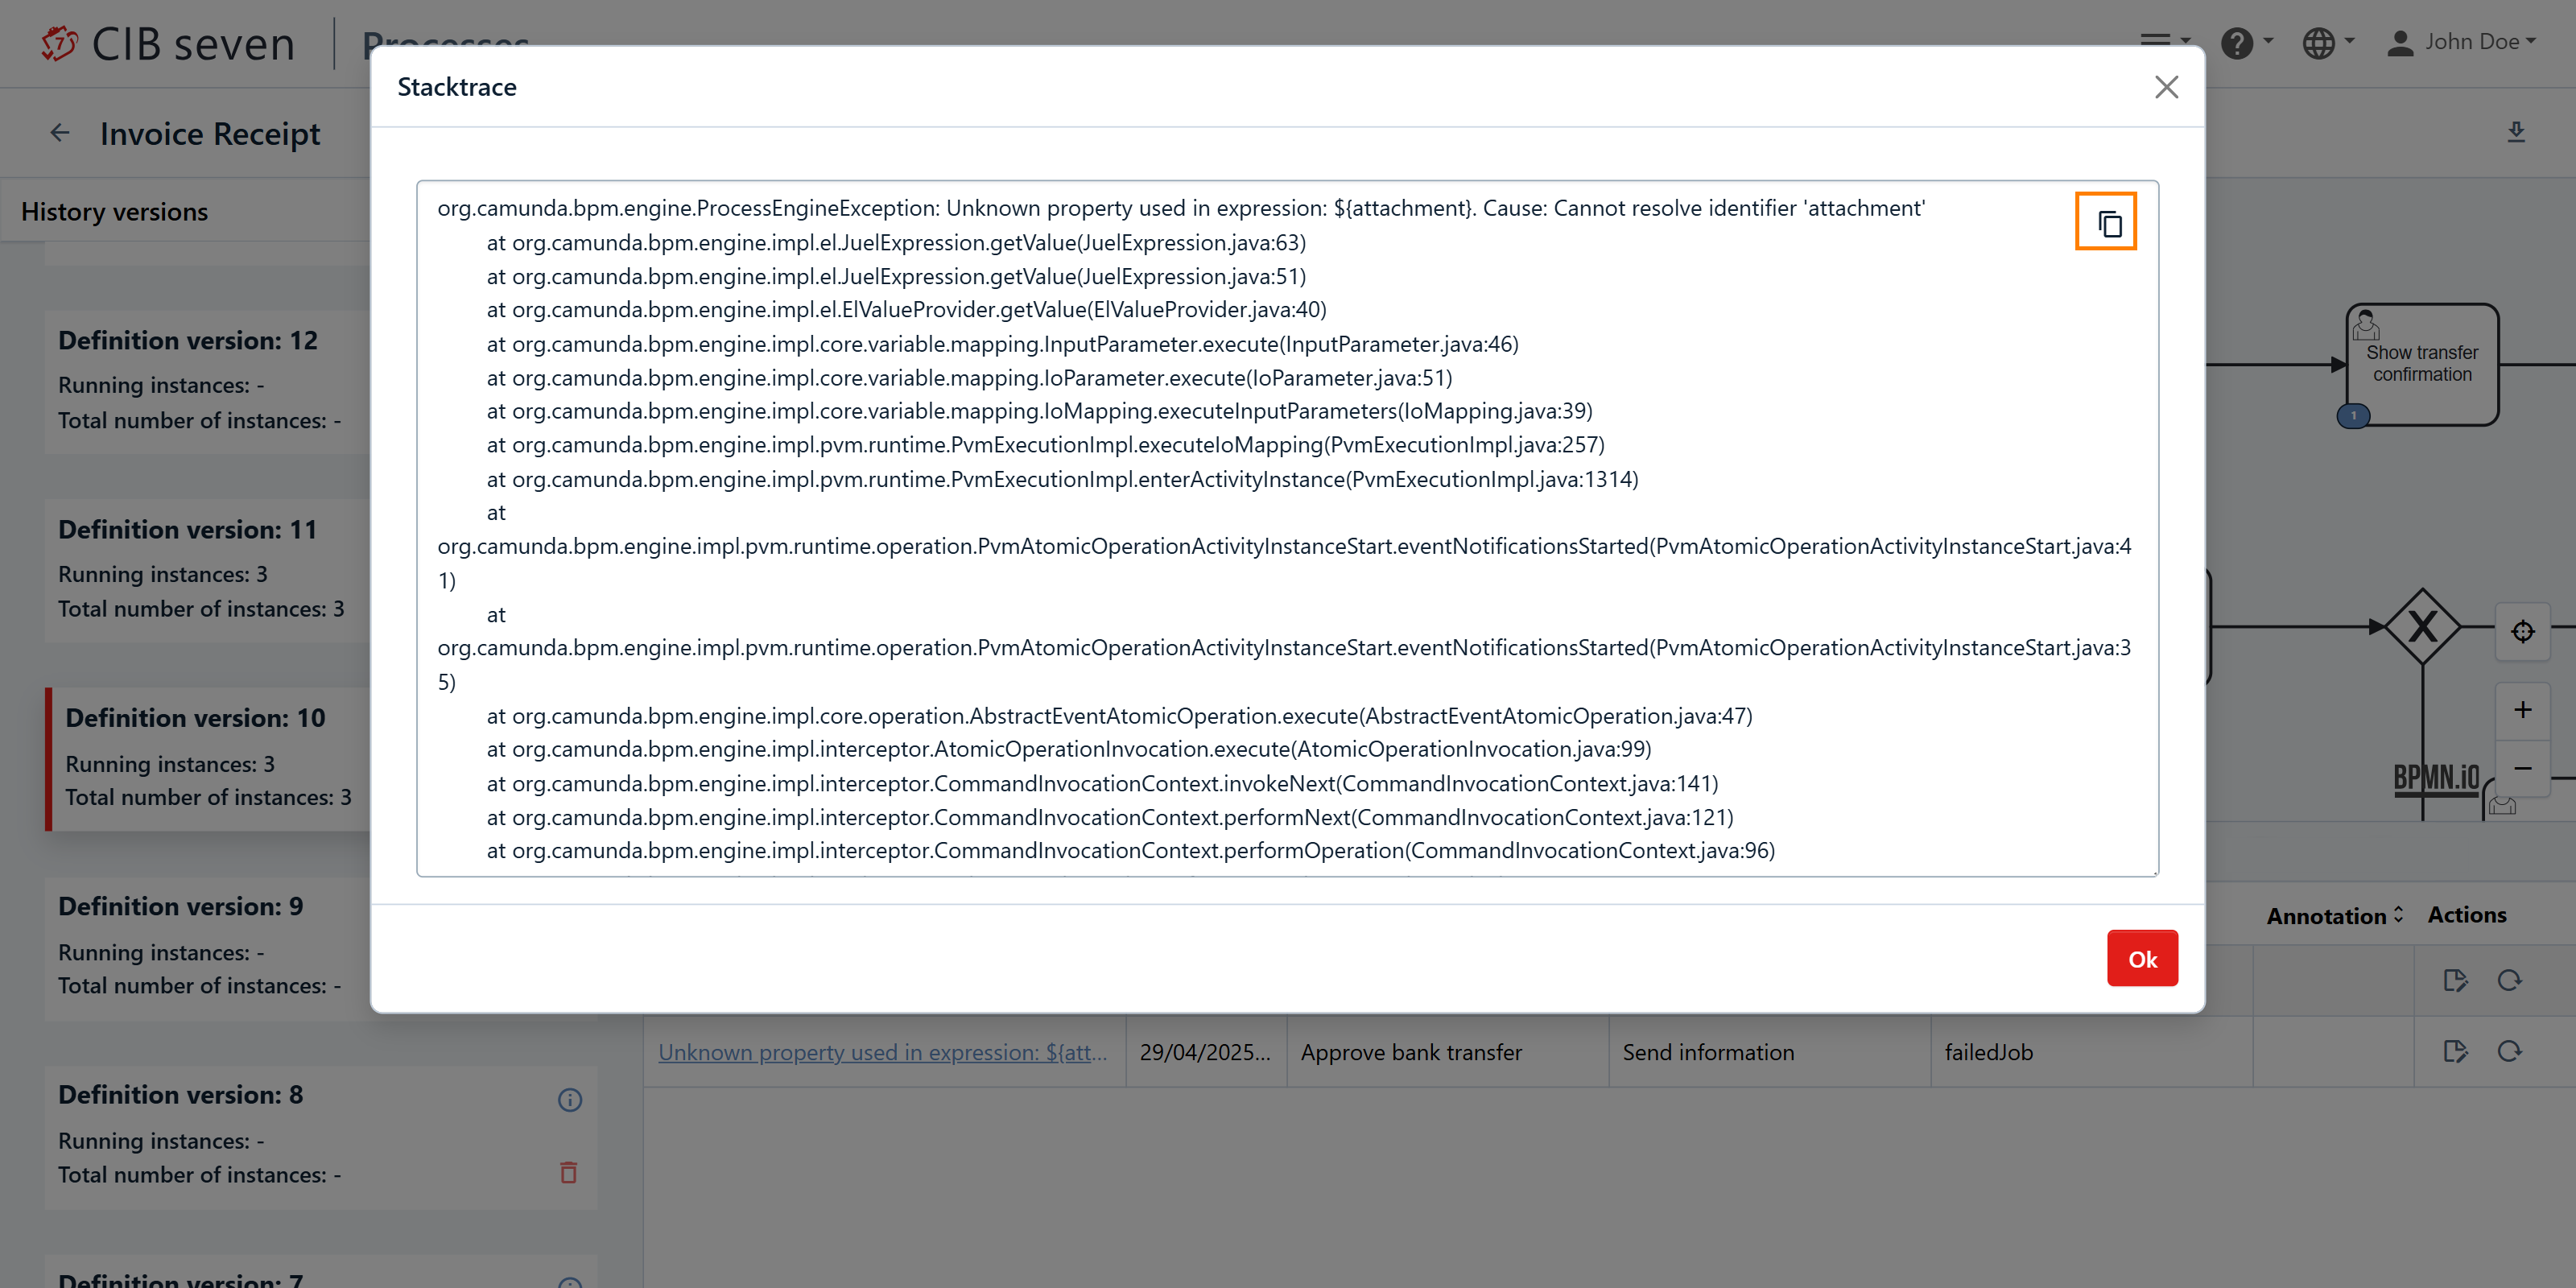
In addition to reviewing the details, the Incidents tab provides several actions to help resolve the incident. You can add an annotation to provide more context or information about the incident, which can be helpful for future reference. Furthermore, if the issue is temporary or resolvable, you can attempt to retry the job that caused the incident. This retry action can be initiated directly from the incident view, helping to quickly recover from certain errors without needing manual intervention.
Called Process Definitions
You can navigate from a process containing Call Activities to the corresponding called process definitions. To do this, click on the tab 'Called process definitions' or on the the blue paper clip icon located in the lower-right corner of the call activity as also shown in the screenshot.

There are three possible states:
- Running and referenced: There is a running process instance, and the called process definition can be identified without any runtime information.
- Running: A process instance is currently invoking this process definition, but it can only be resolved at runtime and is specific to that particular instance.
- Referenced: There is no runtime information available.
Information
When a process is called using a process variable or expression (meaning the specific process to be called is determined at runtime), the exact process cannot be determined until the process is actually executing. In these cases, the blue link icon (which usually allows you to navigate to the referenced process definition) will appear greyed out. This greyed-out icon will only become blue if there is a currently running process instance at that call activity
Enterprise Features
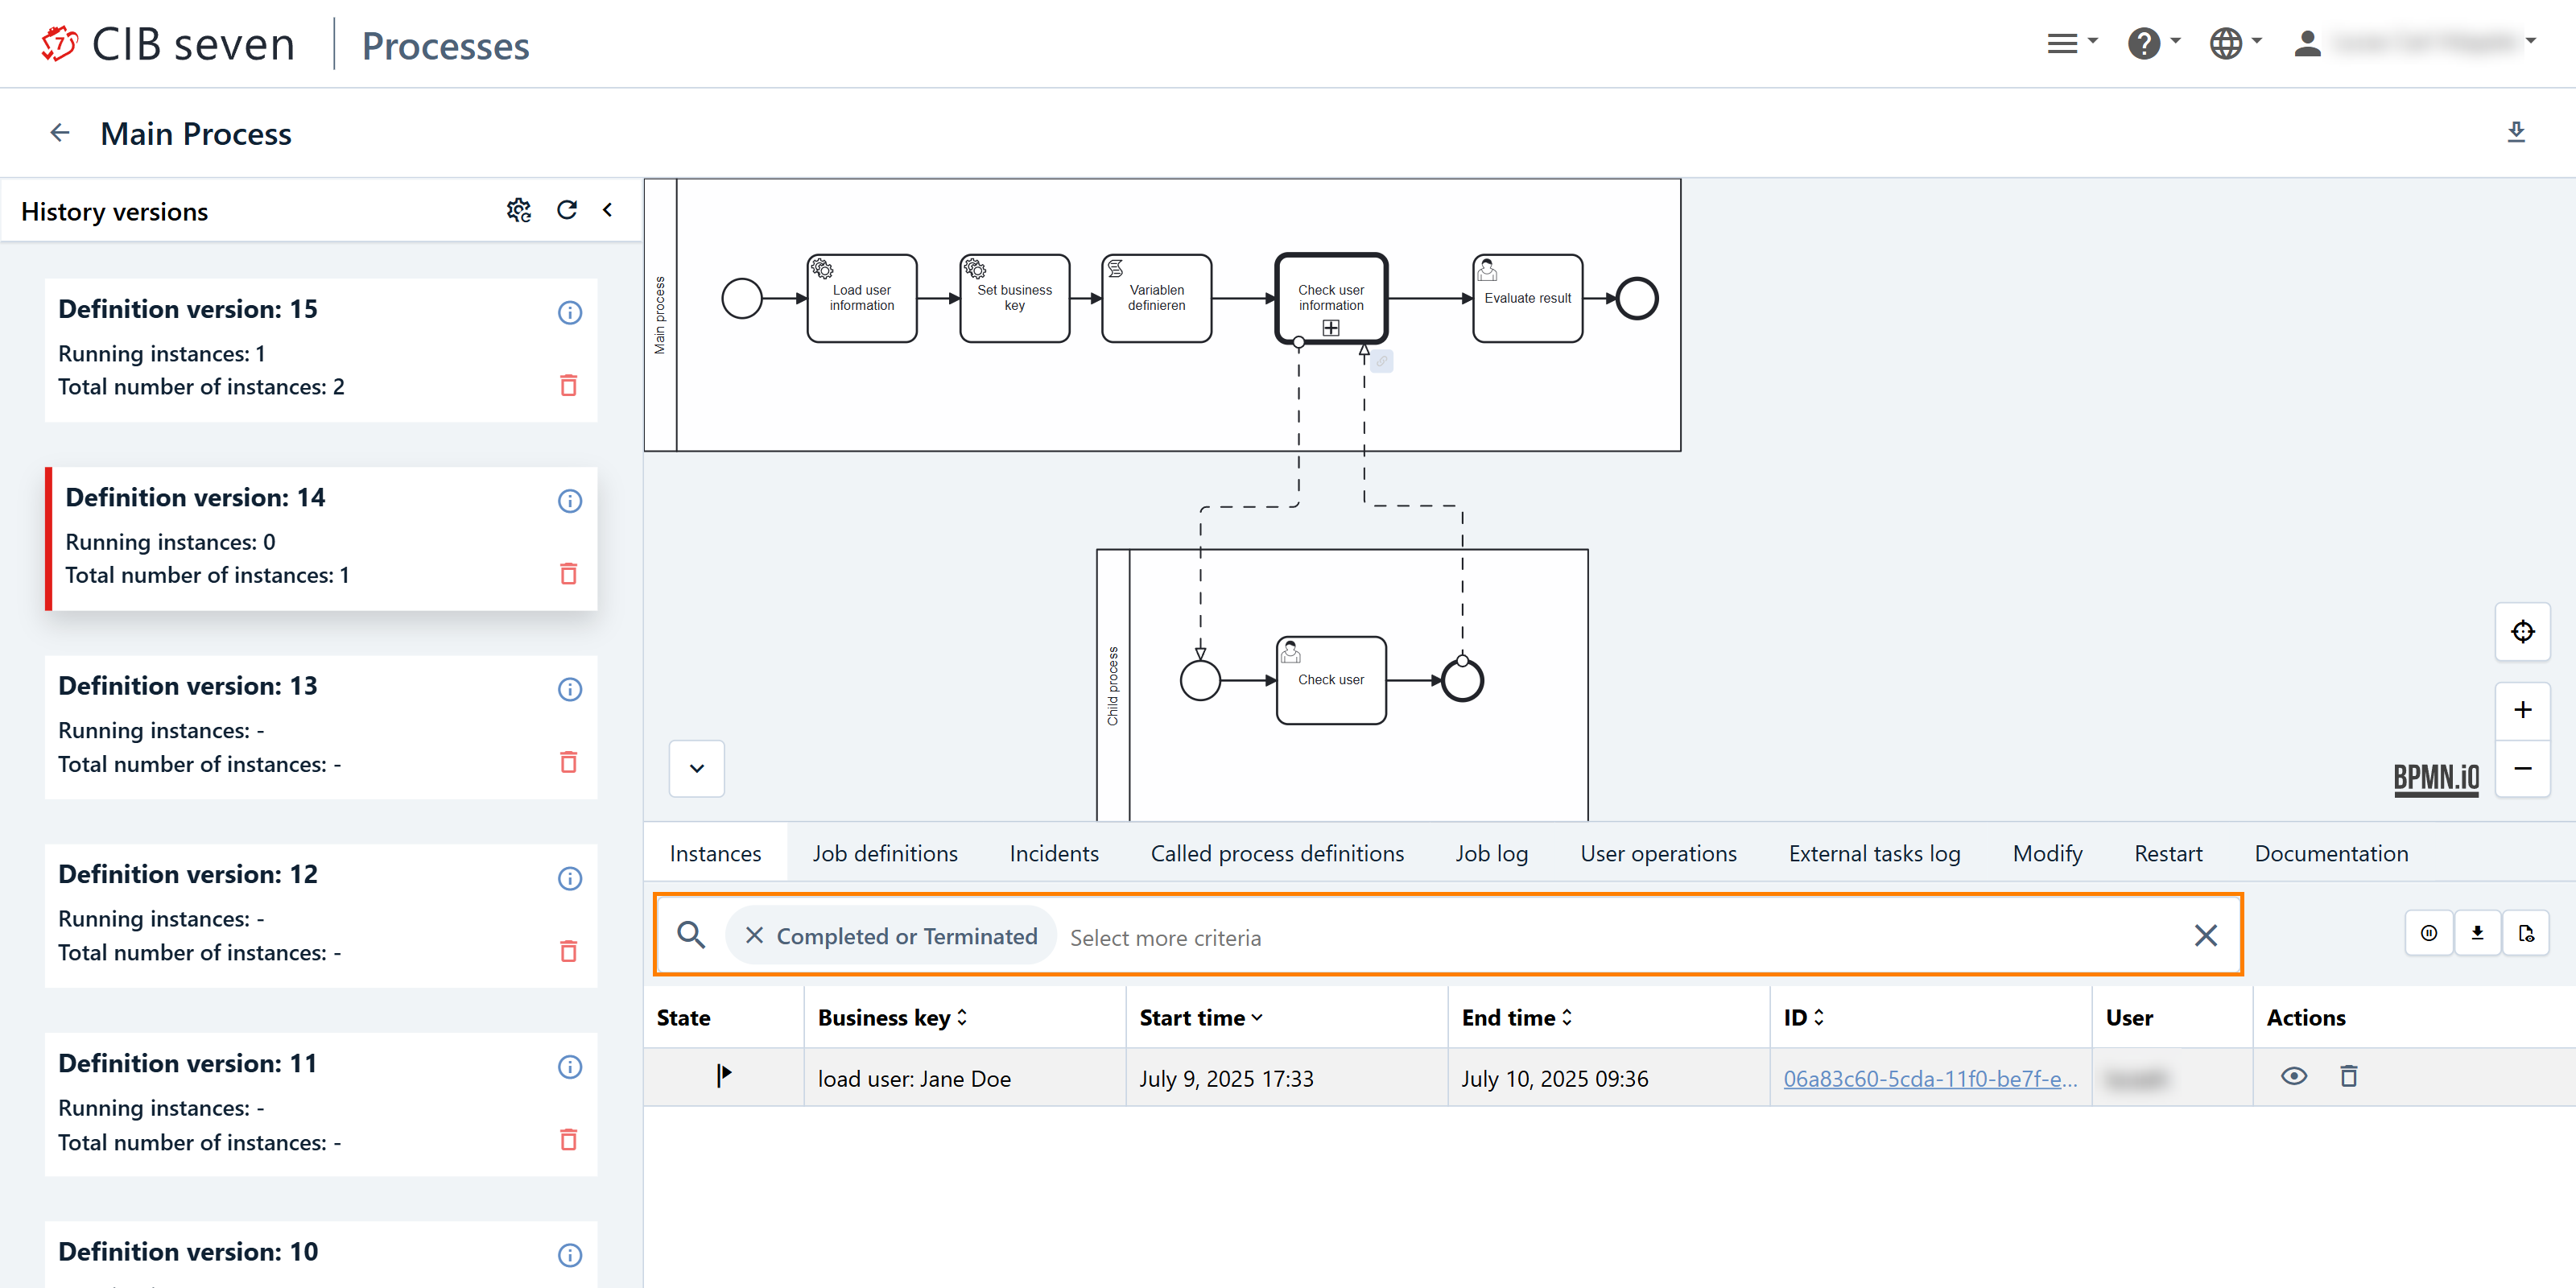
The following functions are enterprise features of CIB Seven. First, in the enterprise version, there will be an advanced search functionality in the 'Instance Tab', allowing us to search for very specific instances. If we click on it, we will see a wide selection of different options. Alternatively, we can enter text. Experiment with this search a bit.
In the screenshot, we made an example and searched for all 'Completed or Terminated' instances. Only the instances that fulfill this criteria are shown.
Job Log Tab
The Job Log tracks the execution of asynchronous jobs within BPMN processes. It allows users to view job details and check the status of the jobs.
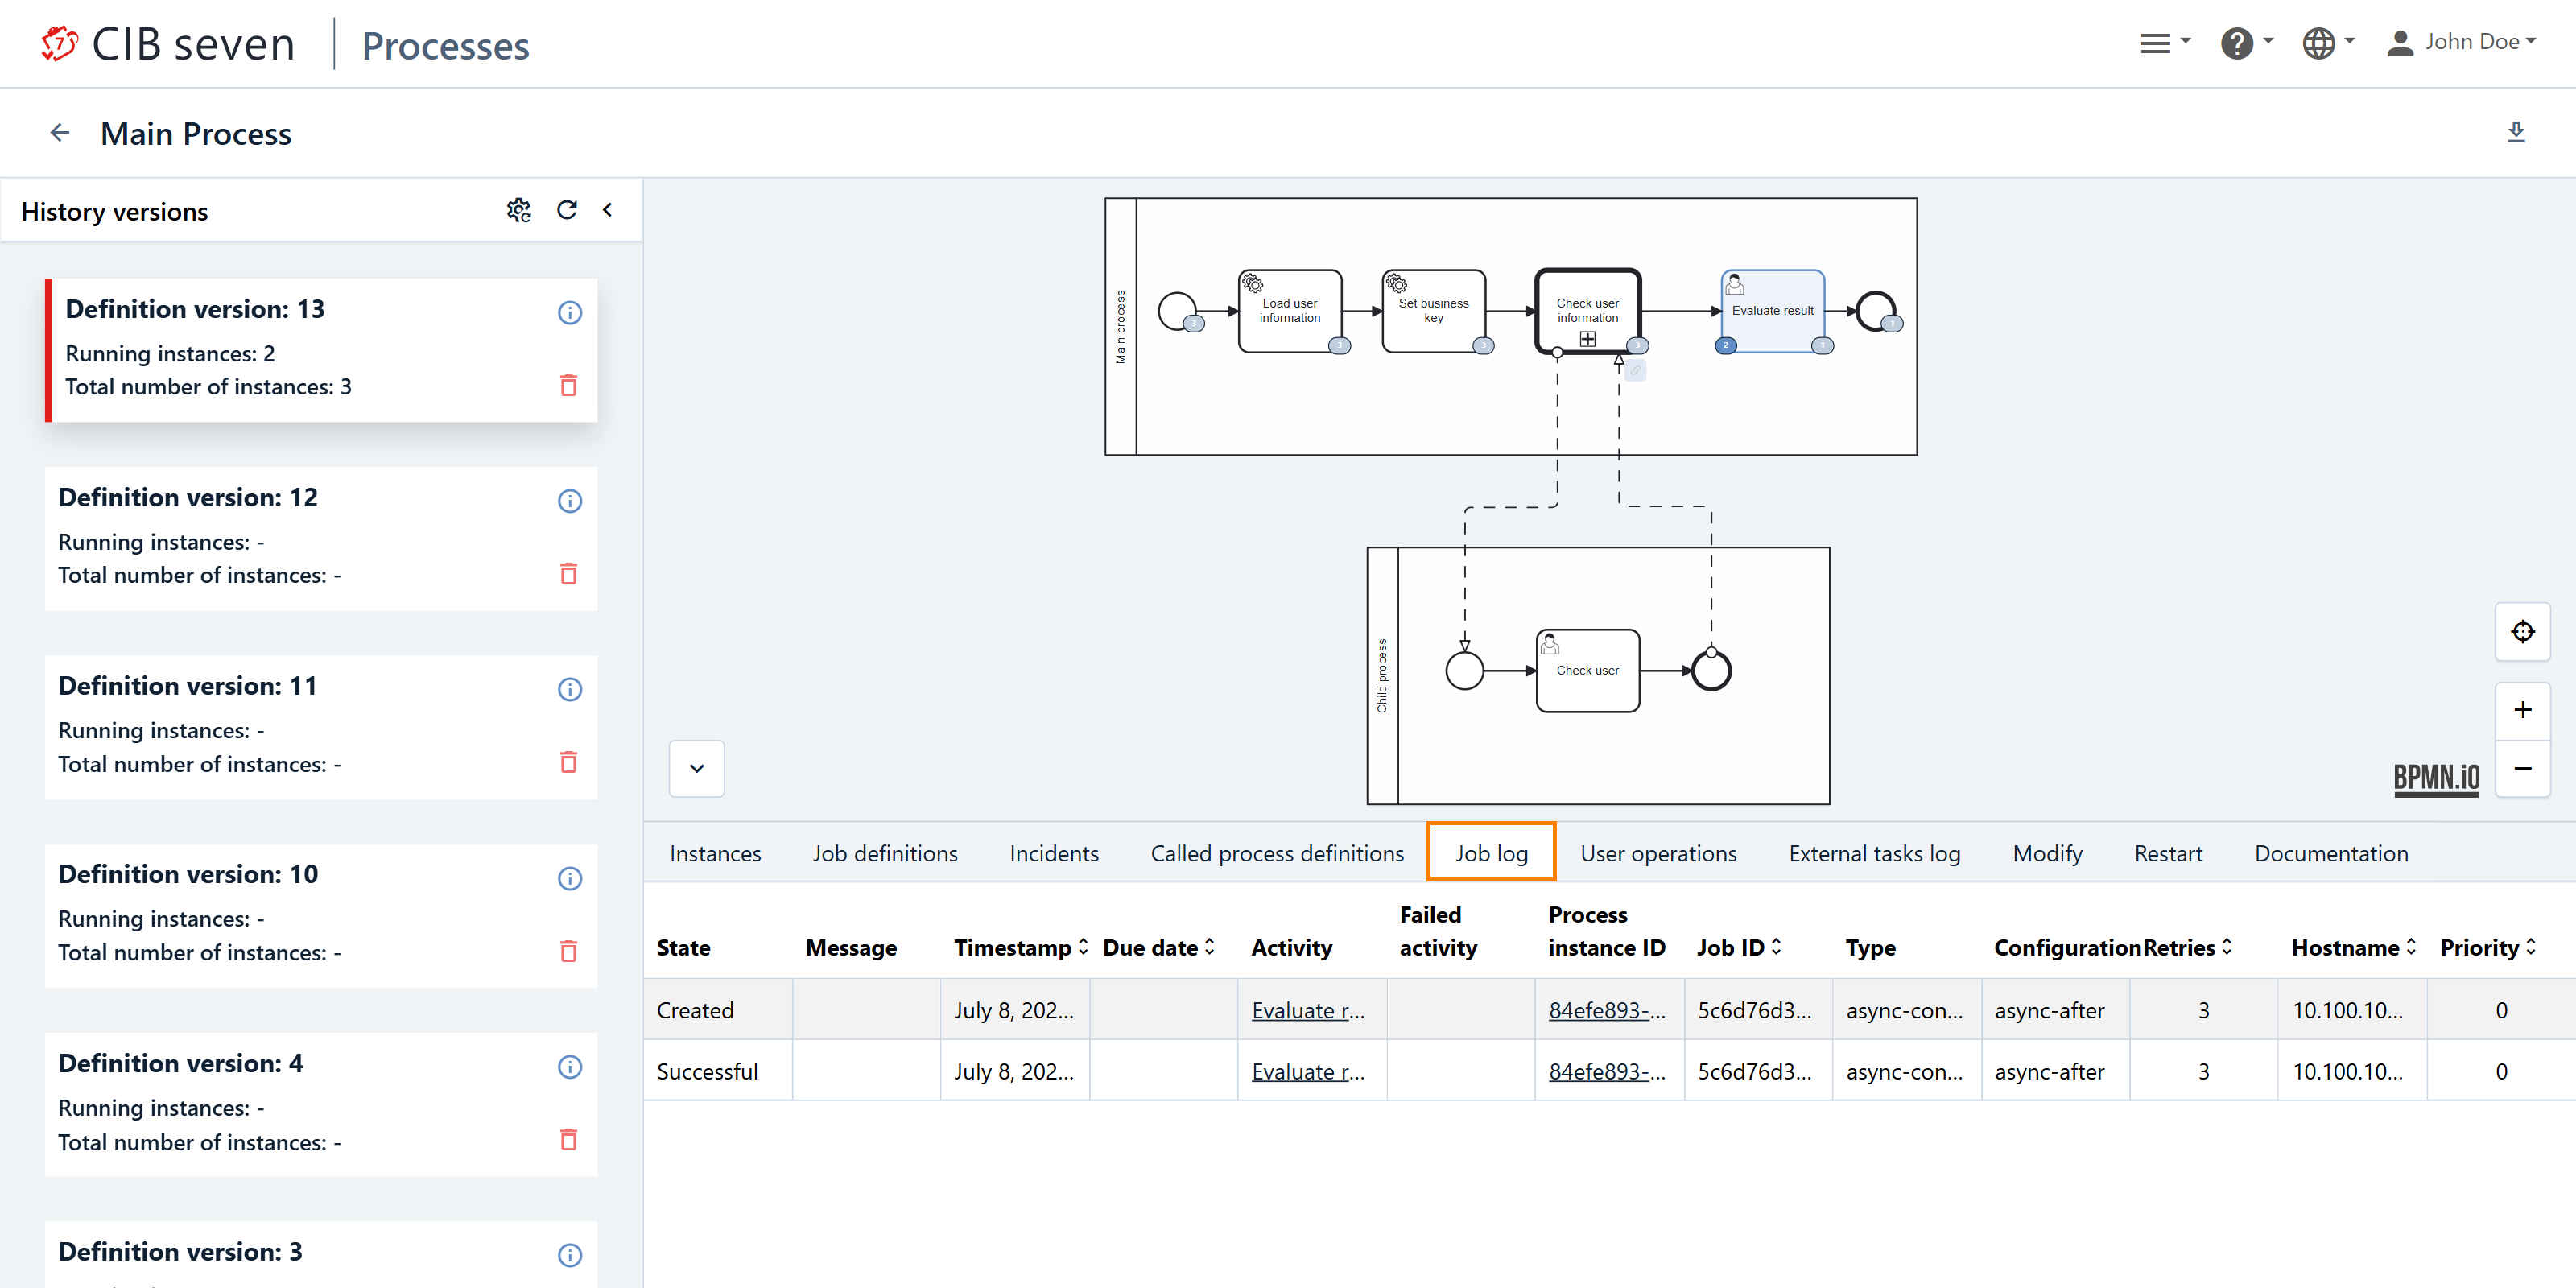
By selecting the relevant activity, the preview highlights the task in grey/blue, making it easy to identify and manage.
User Operations Tab
User operations is an enterprise feature. In this tab, you can see who performed an operation and at what time.
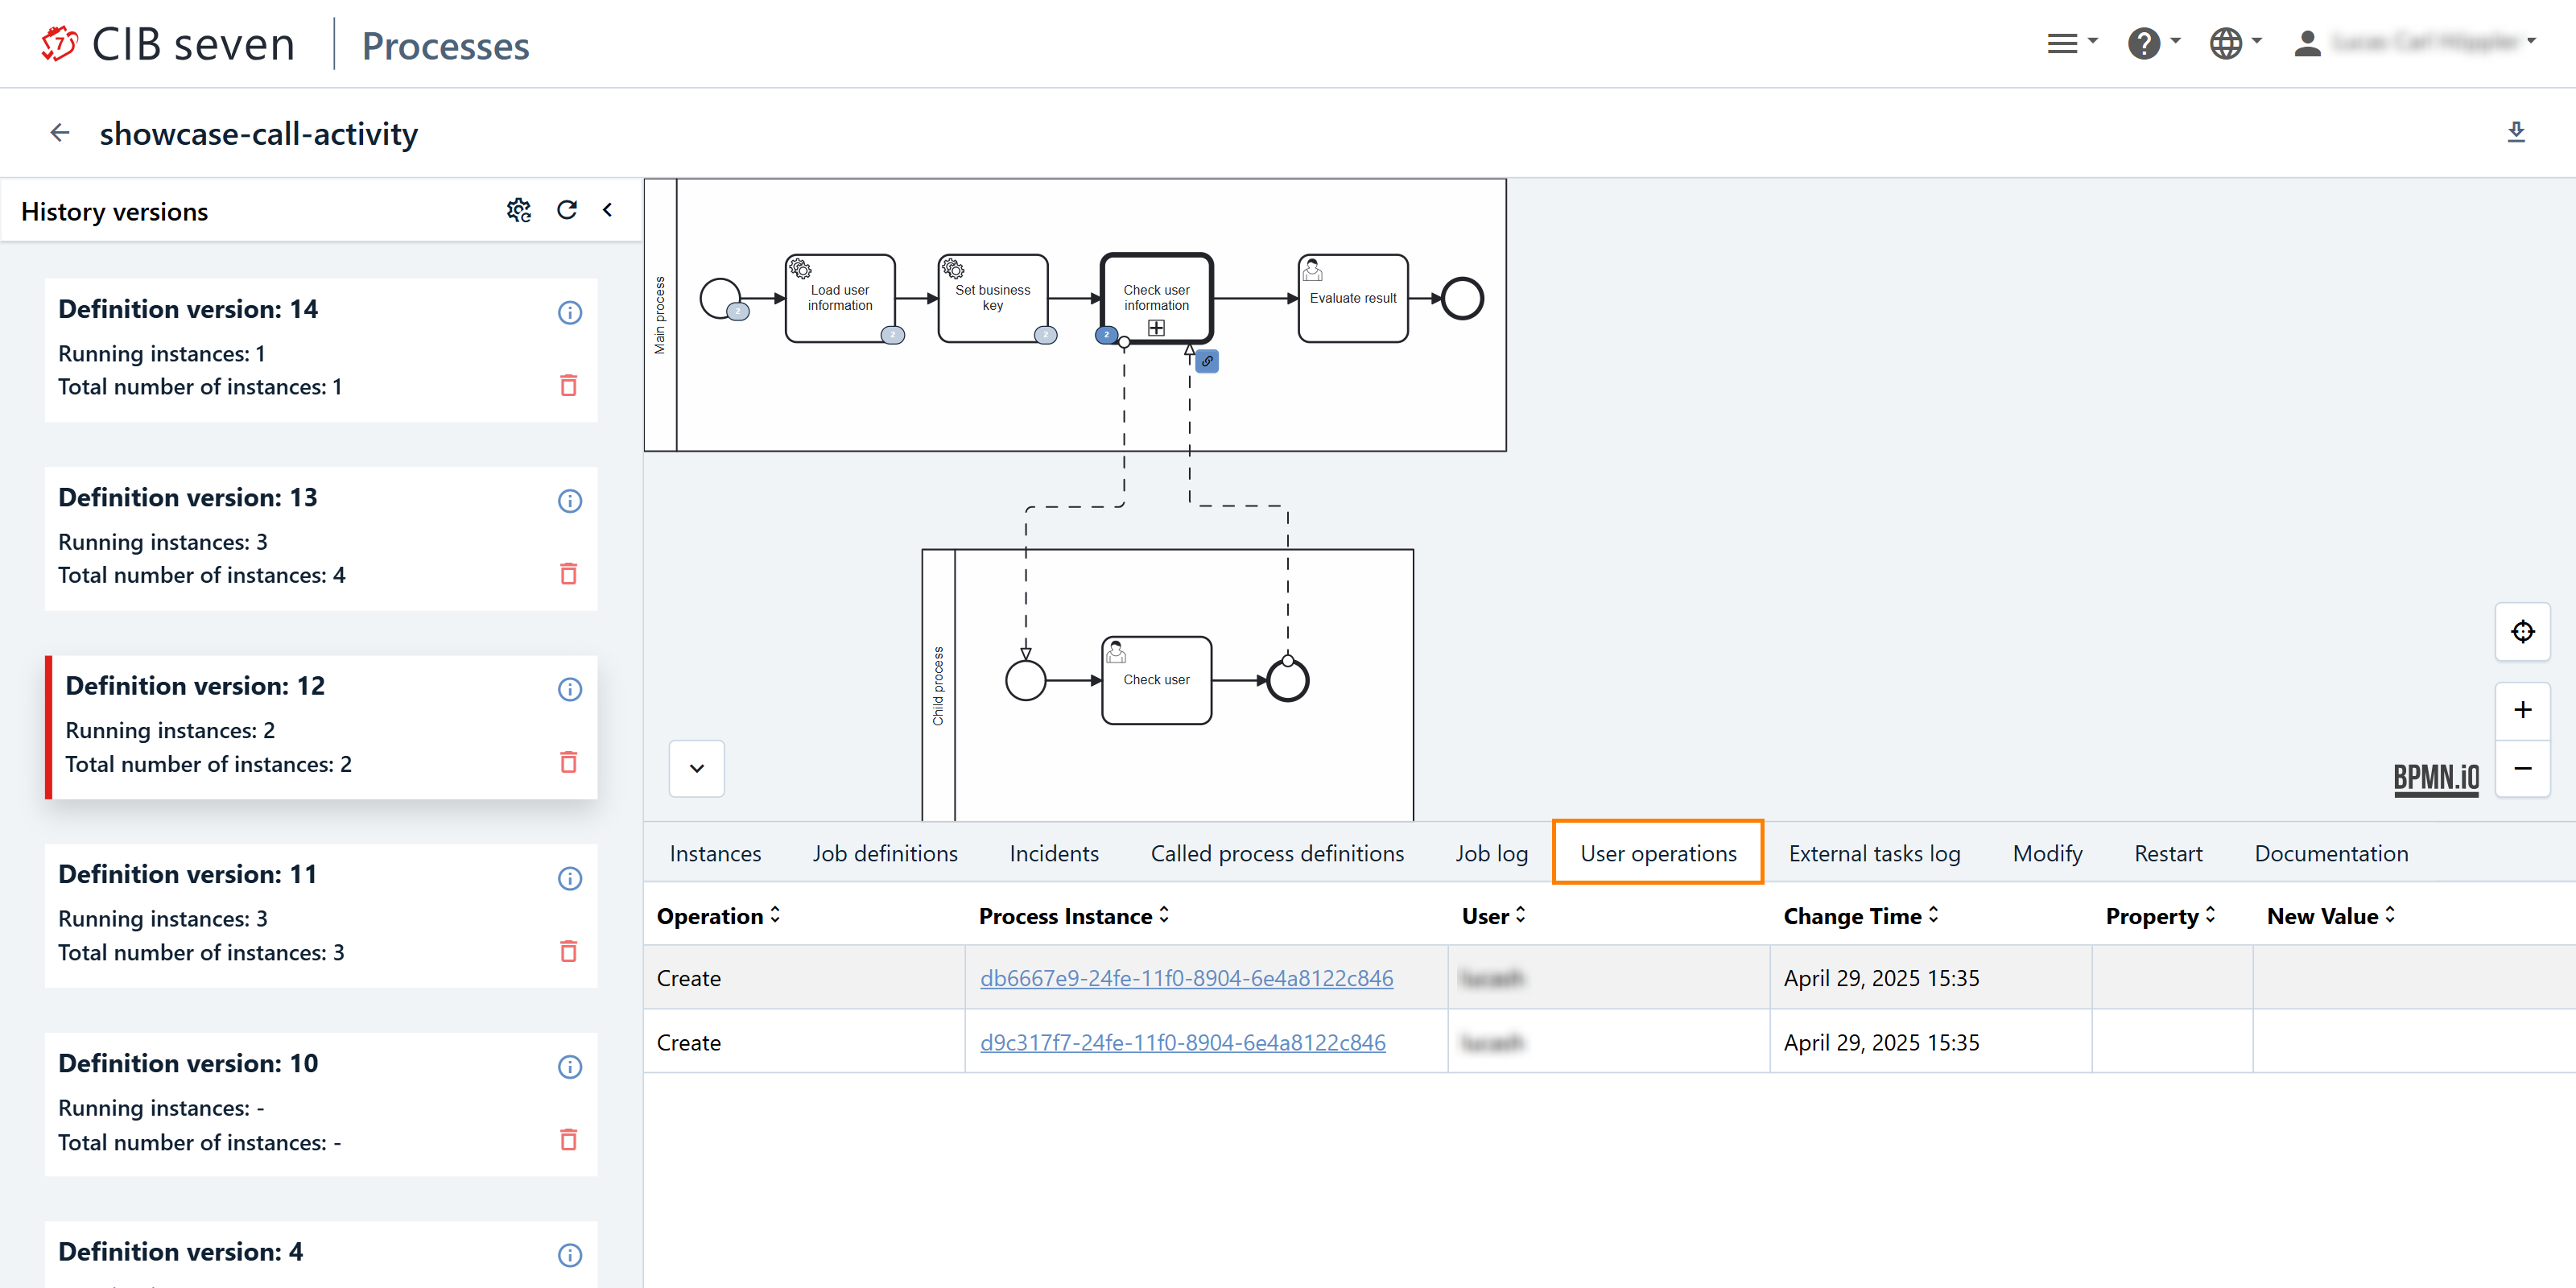
In detail, you can view:
- User: The user who performed the operation.
- Process Instance: The specific process instance affected.
- Timestamp: The exact time of the action.
- Operation Details: Information on what action was performed (e.g., task assignments, completions).
- Property / New Value: The property and new value.
This tab is helpful if you want, for example, to review logs of user actions on sensitive financial tasks. By checking the user, timestamp, and process instance, you can ensure that only authorized users completed the tasks. This helps maintain compliance and provides an audit trail for security and regulatory purposes.
External Tasks Log Tab
External Task Logs is an enterprise feature. External Task Logs in CIB Seven are valuable for tracking and troubleshooting external tasks by providing details such as task state, error messages, retries, and timestamps. They help identify and resolve task failures quickly, monitor task performance, and ensure tasks are processed in a timely manner. The logs also provide context by linking tasks to their Process Instance ID, helping to trace issues within the broader workflow. Additionally, the logs support audit and compliance efforts by maintaining a detailed history of task execution.
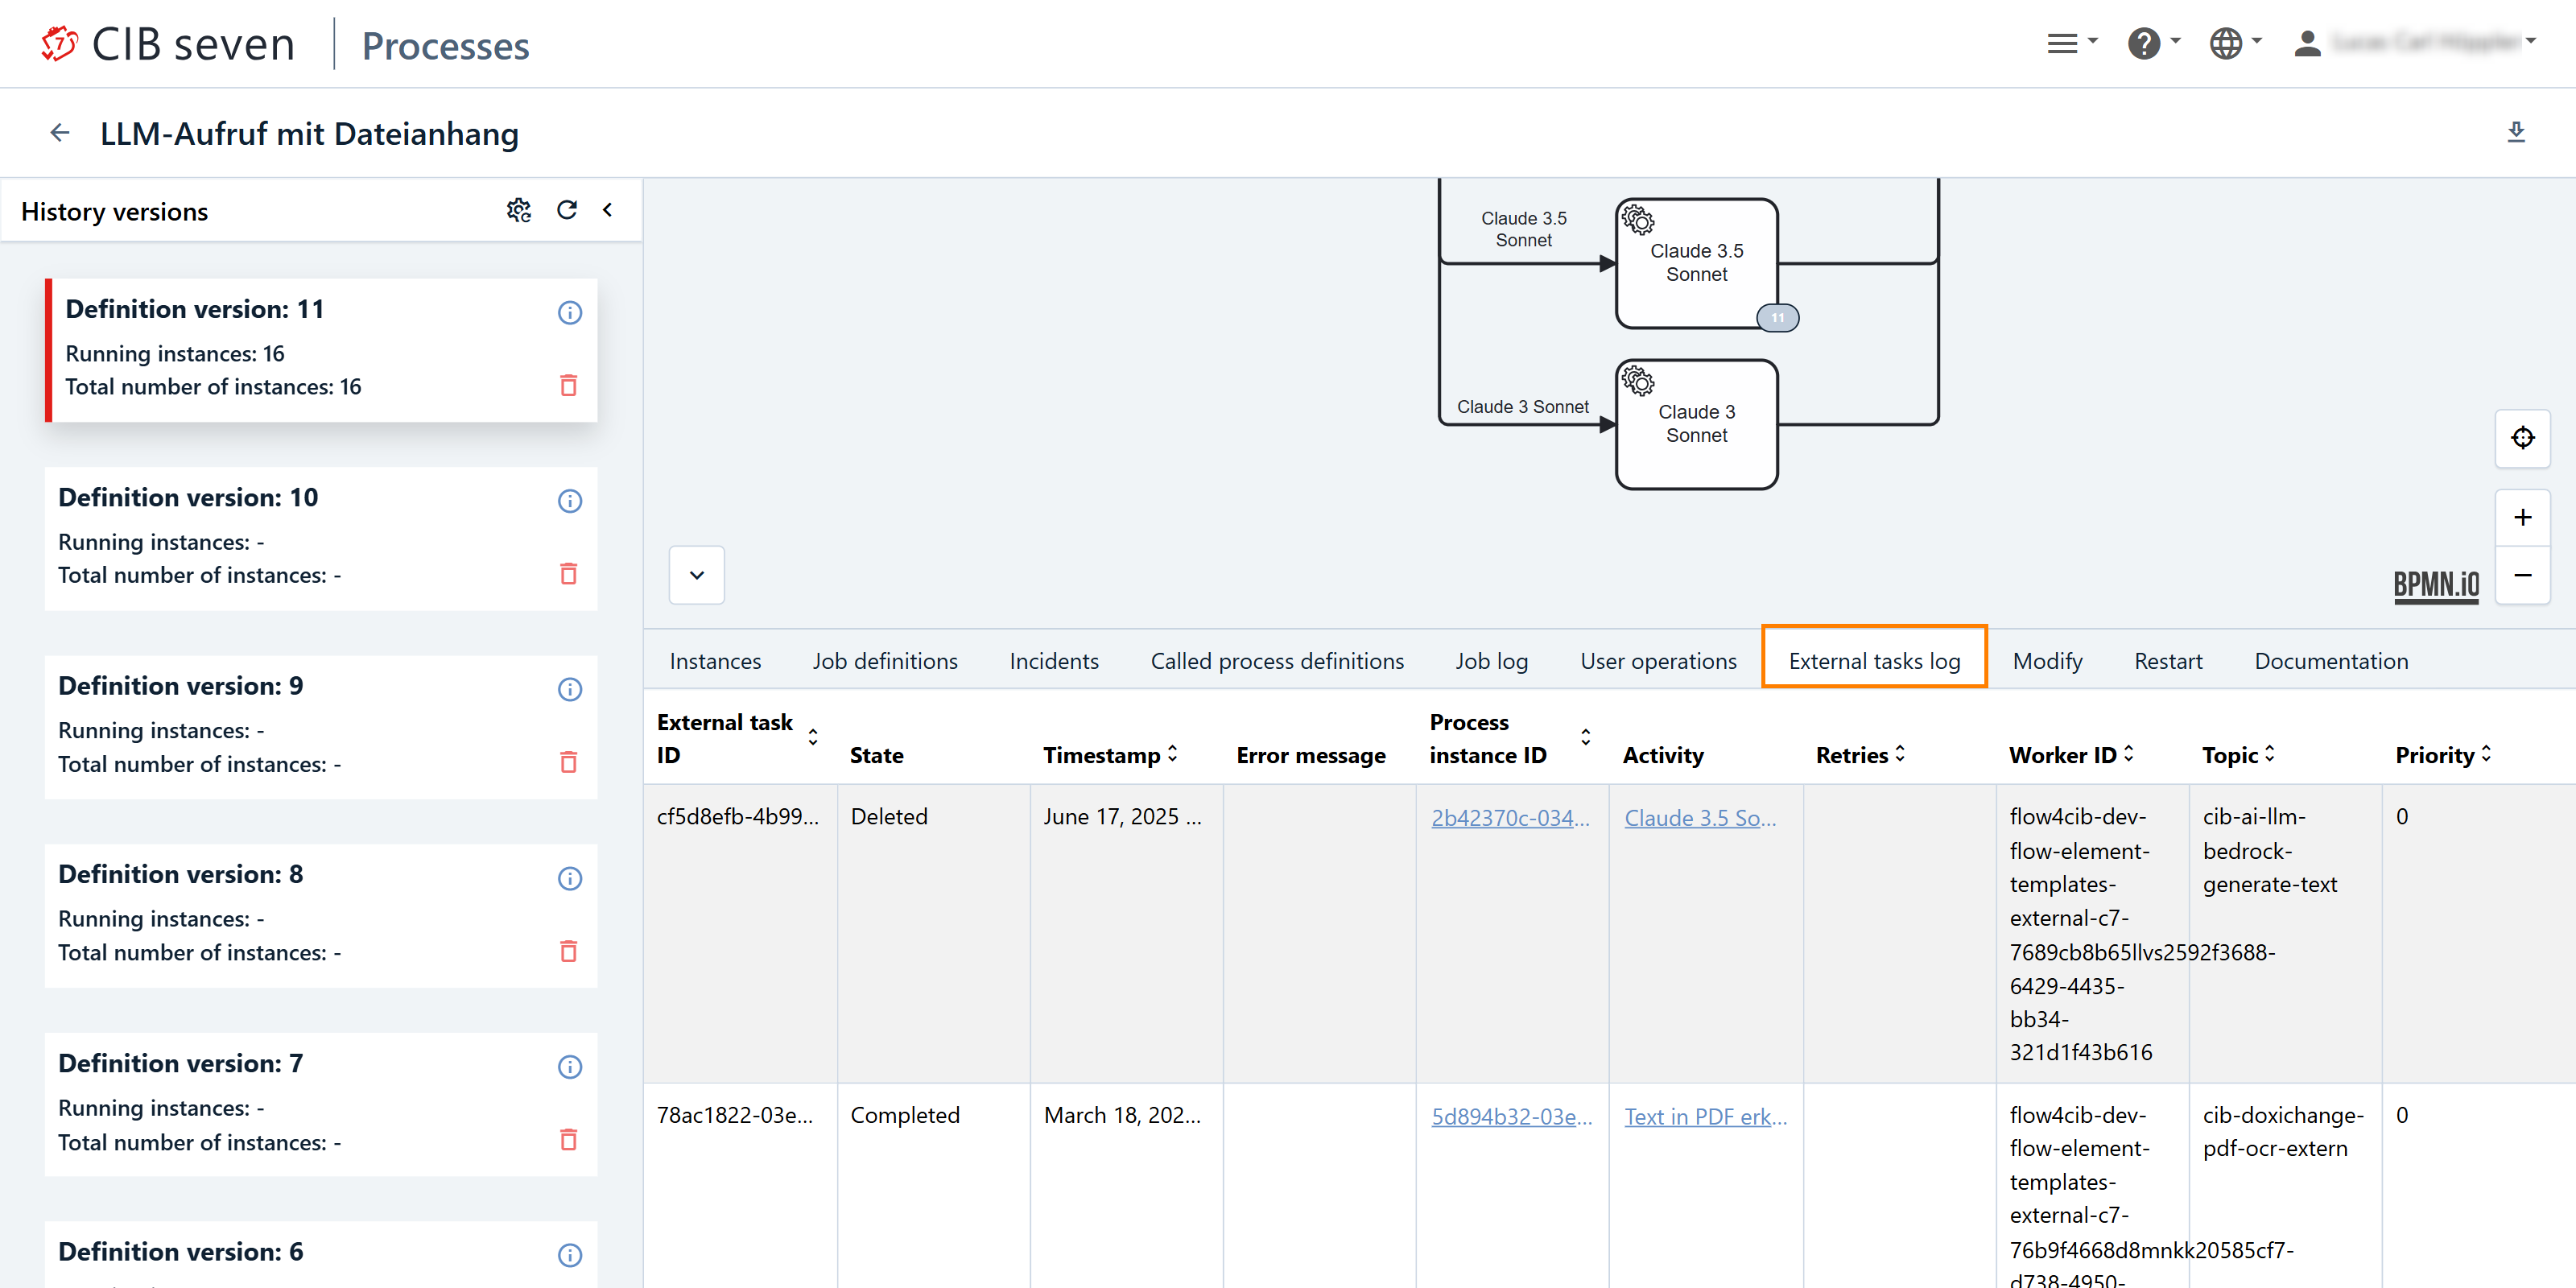
In this view, we can see a table with the following information:
- External Task ID: A unique identifier for the external task. It helps to track and reference the task throughout its lifecycle.
- State: The current status of the external task, such as waiting, locked, completed, or failed. This provides insight into whether the task is active or completed.
- Timestamp: The exact date and time when the external task was created, completed, or failed. This helps track when the task was processed or when issues occurred.
- Error Message: If the task failed, this column contains the error details, explaining the reason for failure (e.g., network issues, invalid data).
- Process Instance ID: The ID of the process instance to which the external task belongs. It links the task to the larger process, helping you trace its context in the workflow.
- Activity: The name of the activity in the BPMN process associated with the external task. This indicates what part of the process the task represents.
- Retries: The number of times the task has been retried after a failure. This helps identify tasks that are repeatedly failing and might need further investigation or resolution.
- Worker ID: The identifier of the external worker (or system) that is processing the task. This helps track which worker is responsible for executing the task.
- Topic: The topic associated with the external task, which helps group tasks into categories for processing by specific workers or systems.
- Priority: Indicates the priority level of the external task, helping to manage the order in which tasks should be processed (e.g., high, medium, low).
Modify Tab
Here, we want to refer to the section Process Modification for more details.
Restart Tab
Here, we want to refer to the section Process Instance Restart for more details.
Documentation Tab
This feature allows you to inspect documentation added in the Camunda Modeler. To do so, open the Documentation tab. The documentation table lists all documented elements. Click on a table row to highlight the element in the diagram.
To view long documentations, click on the on the element or the documentation link in the table. This opens a modal which displays the formated documentation in a textbox. To copy the documentation to the clipboard, click on button.