Global Overview
Global Overview
The Global Overview page provides a high-level summary of your process performance across time.
It brings together key performance indicators (KPIs) and visual trends to help you quickly understand how your processes are behaving, identify performance shifts, and detect potential issues early.
Page Navigation
At the top of the page, you’ll find a set of filters that allow you to refine the analysis:
- Process Name: Select one or multiple processes to display.
- Process Version: Choose a specific version of the selected process.
- Timeframe: Define the time interval for the data being analyzed.
- Calendar: Select a specific time intervale to be analyzed or preset time periods.
The visualizations and KPIs will automatically update based on your selected filters.
Key Metrics
The page highlights eight main KPIs, which summarize overall process execution and performance:
- Started Instances: Total number of process instances that have been started, with a start date inside the selected time period.
- Finalized Instances: Number of process instances that finalized inside the selected time period.
- Successful Instances: Number of process instances that completed successfully inside the selected time period.
- Average Process Duration: Average time taken for process instances to complete that have been completed inside the selected time period.
- Canceled Instances: Number of process instances that were canceled before completion inside the selected time period.
- Incidents: Total count of incident occurrences and errorStartEvents that have occurred inside the selected time period.
- Completed User Tasks: Percentage of completed user tasks that have been completed inside the selected time period.
- Average User Task Duration: Average time spent to complete user tasks that were completed inside the selected time period.
Interacting with the Metrics
Each KPI card is interactive.
When you click on one of the metrics, the time series graph below will automatically adapt to display the evolution of that metric over time — helping you identify trends, anomalies, or performance improvements.
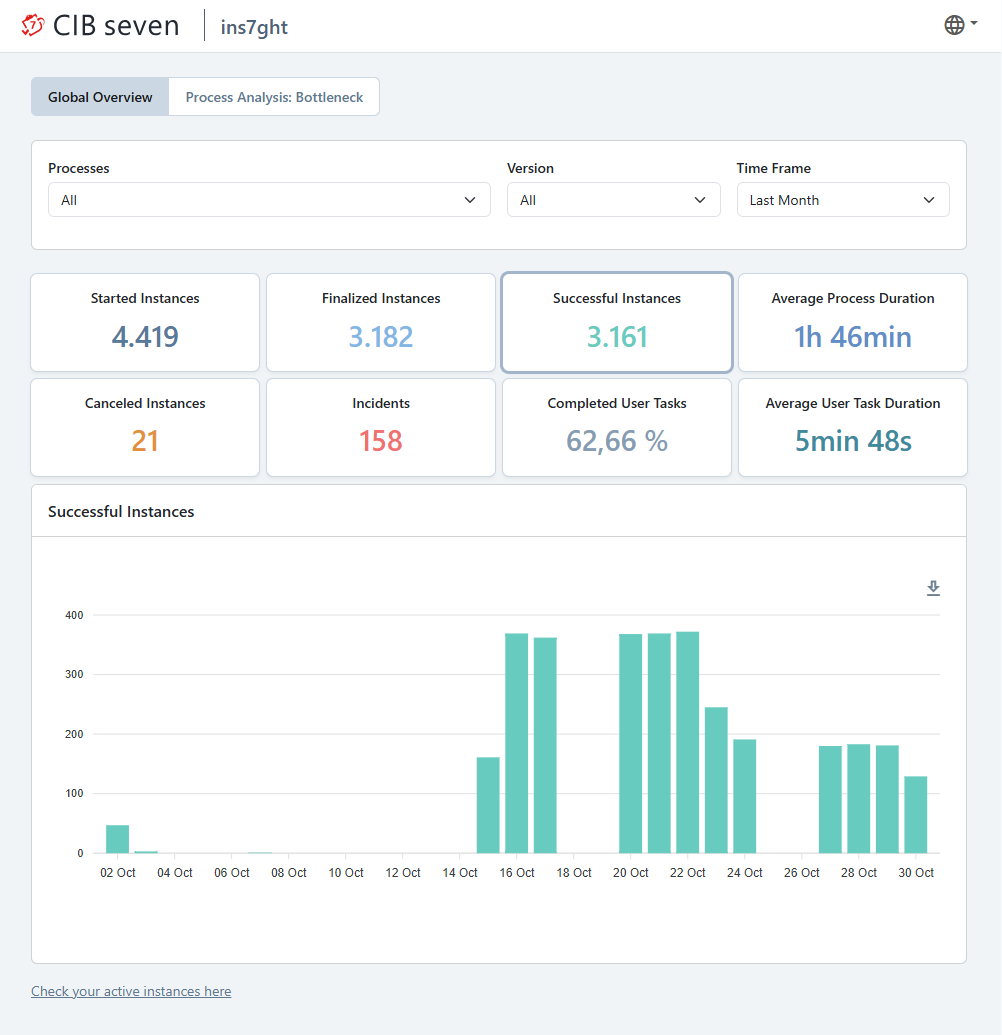
You can also hover over any point in the graph to see the exact values for that date or period.
Reading the Graphs
The graphs are designed to help you:
- Track performance trends over the selected timeframe.
- Compare different metrics side by side.
- Spot spikes, drops, or gradual changes that may indicate process inefficiencies or improvements.
Tooltips and legends are available to clarify what each data line represents, ensuring a clear and intuitive interpretation.
Insights at a Glance
The Global Overview page is ideal for:
- Monitoring process health and stability.
- Identifying unexpected changes in process execution.
- Understanding the overall impact of incidents and user activity.
- Providing management with quick, data-driven visibility into operational performance.